Liquidity Levels Pro
Maps where liquidity pools and where it gets taken. The script tracks unswept pivot highs and lows, then scores each zone from 0 to 100 on how often it has been touched, how fresh the last touch is, whether it lines up with prior-day, prior-week, VWAP or opening-range anchors, and how violently price has reacted there, scaled by the current market regime and the time of day. It marks sweeps as they happen and carries a HUD of the key reference levels plus a trend, mean-revert or mixed read with a confidence percent.
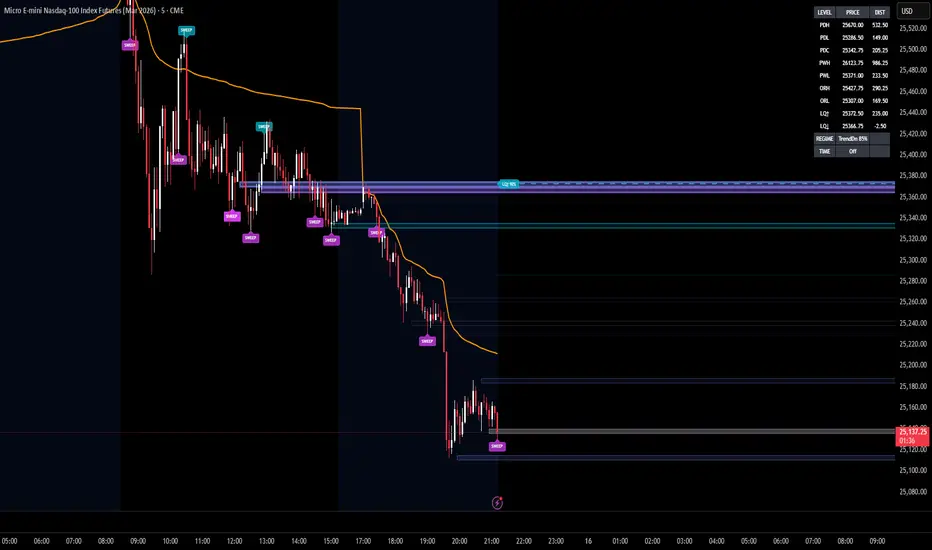
Plate 01
I · Methodology
How it reads the market
Liquidity does not pool randomly. It collects at swing points the market has registered but not yet traded through: old highs, old lows, equal highs, equal lows. The next sweep, more often than not, happens at the closest one with the most weight behind it.
The script walks every bar looking for pivot highs and pivot lows (three bars left, three bars right by default), and either creates a new zone at each pivot or merges it into an existing one if the price is within twelve ticks. Each zone tracks its number of touches, the bar of its last touch, and a running record of how price reacted: fast moves, slow moves, continuations through and rejections away.
Every bar, each zone is re-scored on a 0–100 scale. Touches contribute up to 60 points, freshness up to 40, confluence with the prior-day high/low/close, prior-week high/low, session VWAP or the opening range adds another 40. A "fast reaction rate" (the share of touches where price travelled at least 14 ticks within two bars) adds up to 22 more, and the score is then multiplied by regime and time-of-day adjustments: midday with no confluence pays 0.6×, the power hour with confluence pays 1.10×, recently-swept zones are dampened by 0.55× during a cooldown.
Only the top-N zones by score are drawn, with a minimum-score cutoff, and the box border colour blends bull/bear by the zone's history of continuations versus rejections. A trade-planning overlay names the nearest above-and-below zone over the score threshold; the HUD reports the regime (trend up, trend down, mean-revert, mixed) with a confidence percent and the current time-of-day window.
What this does not do
- Does not predict which zone will be tested first.
- Does not generate entries, exits, or alerts on its own.
- Does not work as a standalone strategy. It is a context layer for a trader with a plan.
- Backtesting "unswept-liquidity touches" is a category error; no equity curve is shown because none would mean anything.
II · Parameters
Inputs disclosed
| Parameter | Default | Range | Effect |
|---|---|---|---|
| pivotLeft | 3 | 1–10 | Bars to the left a high must exceed to qualify as a pivot. |
| pivotRight | 3 | 1–10 | Bars to the right a high must exceed before the pivot confirms. |
| mergeTicks | 12 | 1–200 | Distance within which a new pivot merges into an existing zone rather than spawning a fresh one. |
| zonePadTicks | 8 | 1–200 | Half-height of each zone's box around the pivot price. |
| maxZones | 18 | 3–80 | Hard cap on tracked zones; oldest are pruned first. |
| minScoreToDraw | 25 | 0–100 | Score floor for drawing a zone. Below this it is tracked but invisible. |
| maxVisibleZones | 10 | 2–40 | Caps how many of the highest-scoring zones are drawn at once. |
| sweepCooldownBars | 50 | 5–500 | Bars a freshly-swept zone is dampened (×0.55) before it can score normally again. |
III · Source
Open Pine source
Source · Pine v6 · Open
// Pine source available on TradingView.
// Open the script and click 'Source code' to view.
Public · Open on TradingView
Pairs well with